As we all know, Impedance matching is important. So we like to know, how good this matching is. Therefore we like to measure it. Using a VNA we get S-Parameters, calculating Impedance from them seems to be easy:
\[
Z_L = Z_0 \frac{1 + S_{11}}{1 - S_{11}}
\]
\(Z_L = Z(f)\) means impedance depending on frequency
\(Z_0 = 50 \Omega\) is standard impedance
\(S_{11}\) is the measured S-Parameter
Python, scikit.rf and numpy module shold fit. The s-parameters we have already on file.
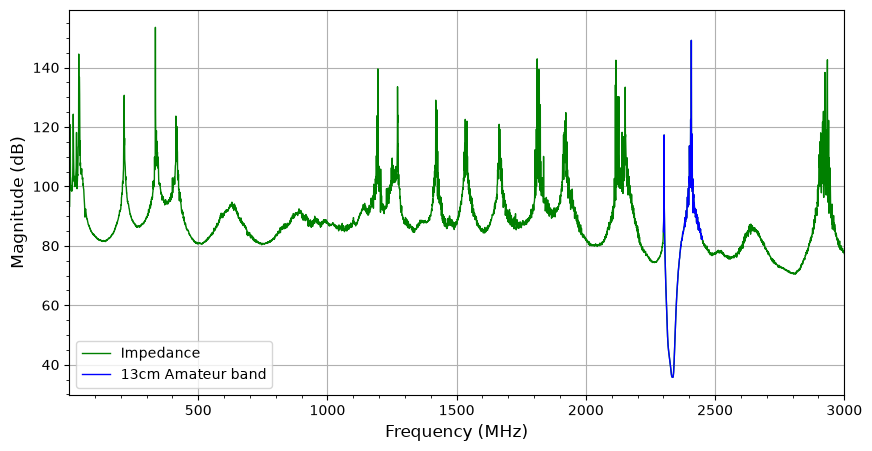
import numpy as npfrom skrf import Network, Frequencyimport matplotlibimport matplotlib.pyplot as pltimport osdef impedance_from_s_param(network, impedance_file="imped.s1p"):"""calculate impedance from networks s11-parameters for every frequency and write impedance file as touchstone for later usage. """ new_filename = impedance_file frq = network.f s11 = network.s[:,0,0] imp = network.subnetwork([0]) imp.name = new_filename z0 =50for i inrange(len(frq)): a = s11[i].real b = s11[i].imag gamma = (abs((a**2+ b**2) **0.5)) vswr =abs((1+gamma) / (1-gamma)) zl = z0 * vswr imp.s[i] = zl imp.comments ="Impedances over Frequencies" imp.name ="Impedance" imp.write_touchstone(new_filename)return imp Z_0 =50# 50 Ohmsfilter= Network()filter.read_touchstone('files/13cmInterdigitalFilterFull.s2p')filter.name ="Filter 23cm"# show the properties from the touchstone fileS11 =filter.s11imped = impedance_from_s_param(S11)imped.name ="Impedance"print("Impedance:", S11)# lets show what we gotplt.rcParams['figure.figsize'] = [10, 5]plt.grid(True)plt.minorticks_on()plt.title =filter.nameplt.xlabel("Frequency (MHz) ", fontsize=12)plt.ylabel("Impedance (Ohm)", fontsize=12)#imped.plot_s_db(c='g', lw=1, label=imped.name)regio ='2300-2450'imped[regio].plot_s_db(c='b', lw=1, label='13cm Amateur band')plt.show()
This looks strange, only the interesting part, resp. the 13cm amateur band, in parts shows an accaeptable impedance of \(50 \Omega\), lets zoom in.
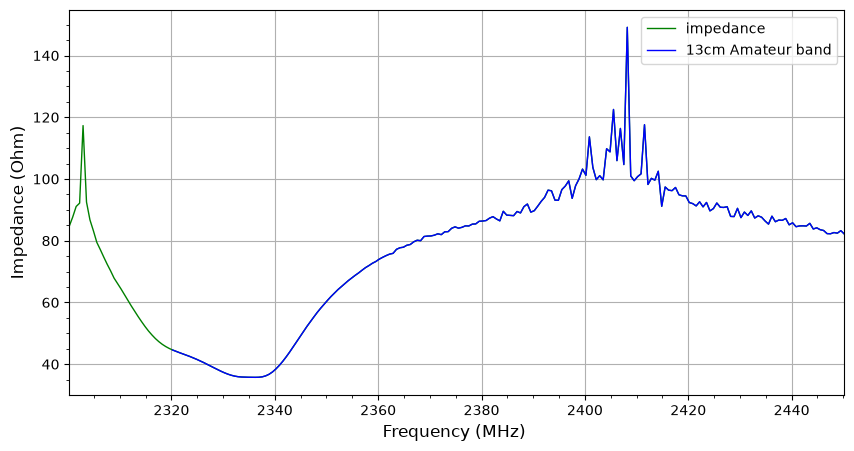
zoom ='2300-2450's11 =filter.s11[zoom]s11.name ="s11"imped = impedance_from_s_param(s11)imped.name ="impedance"print(s11, "(zoom range is fitted onto the available calibration points)")plt.rcParams['figure.figsize'] = [10, 5]plt.grid(True)plt.minorticks_on()plt.title =filter.nameimped.plot_s_db(c='g', lw=1, label=imped.name)regio ='2320-2450'imped[regio].plot_s_db(c='b', lw=1, label='13cm Amateur band')plt.xlabel("Frequency (MHz) ", fontsize=12)plt.ylabel("Impedance (Ohm)", fontsize=12)plt.show()
1-Port Network: 's11', 2300.233333-2450.183333 MHz, 226 pts, z0=[50.+0.j] (zoom range is fitted onto the available calibration points)
The filter justified like this might not be usable for the full 13cm amateur band, but usually you will have some preferences about the used modes and not in need of the whole band.