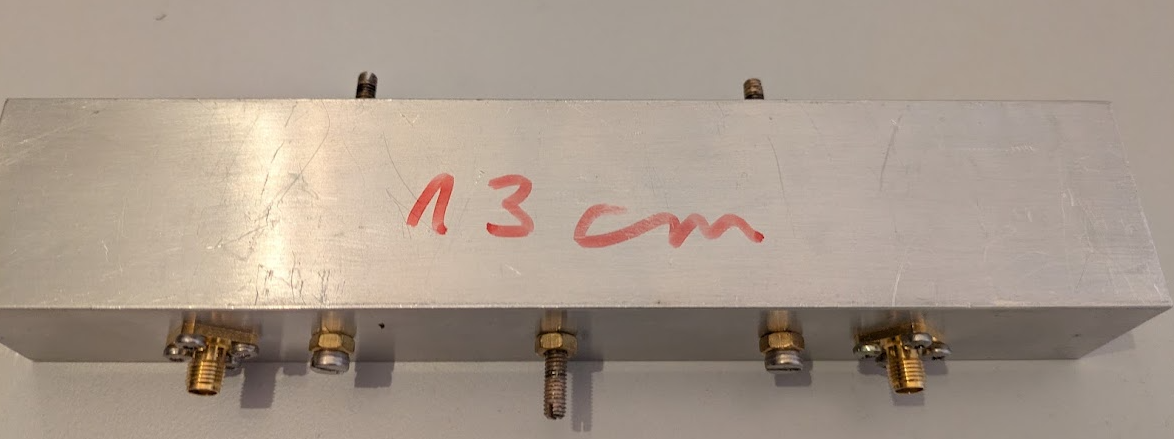
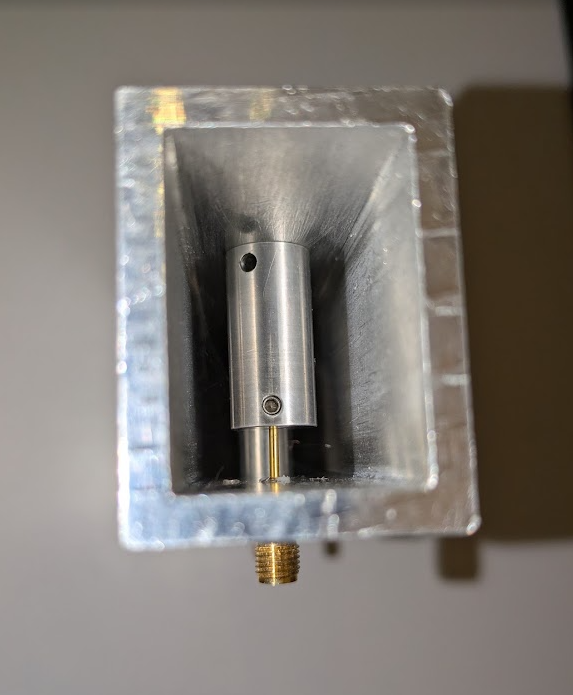
Recently I found a 13cm filter at a fleamarket , probably at Bochum radiotelescope, I don’t remember.
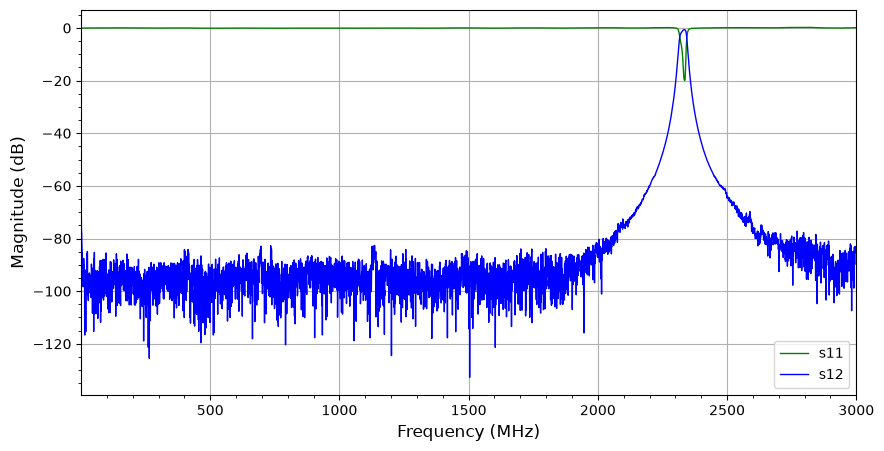
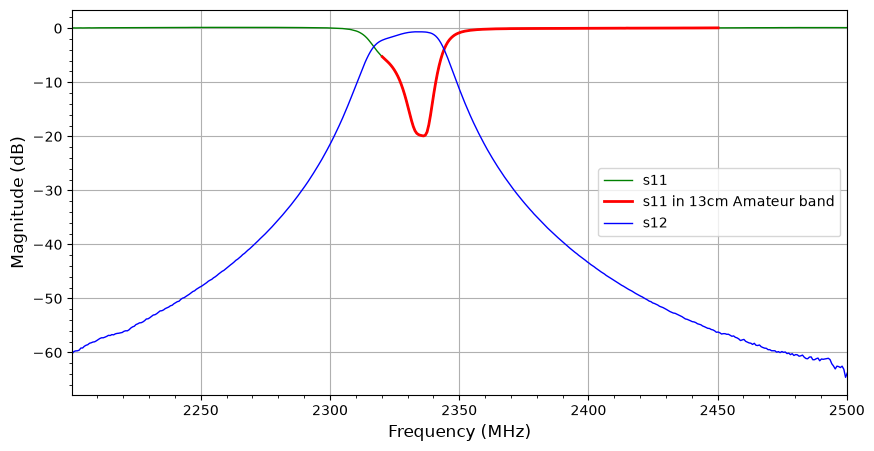
I connected the filter to LibreVNA port 1 and port 2. From the LibreVNA-GUI app I saved a touchstone file. Used frequencies went from 1 to 3000 MHz with 4501 (max) measurement points.
Of course the touchstone file forced me to write some lines of python …
from skrf import Network, Frequencyimport matplotlibimport matplotlib.pyplot as pltimport osfilter= Network()filter.read_touchstone('files/13cmInterdigitalFilterFull.s2p')filter.name ="Filter 23cm"# show the properties from the touchstone fileprint("filter properties:", filter)s11 =filter.s11s11.name ="s11"s12 =filter.s12s12.name ="s12"# lets show what we gotplt.rcParams['figure.figsize'] = [10, 5]plt.grid(True)plt.minorticks_on()plt.title =filter.nameplt.xlabel("Frequency (MHz) ", fontsize=12)plt.ylabel("Signal (db)", fontsize=12)plt.title =filter.names11.plot_s_db(c='g', lw=1, label=s11.name)s12.plot_s_db(c='b', lw=1, label=s12.name)plt.show()