It is a Zeenko product. Plain aluminum with some LEDs and four SMA-connectors.
Wonderful manuals are included printed on DIN A6 paper to fit in the box.
Nevertheless they are available at their github account as sources, so I can have my own pdf files and print them on my A4 paper … Beautiful typesetting and content.
It is a 2-Port VNA. Compared to professional equipment from R&S or others, it is cheap, so I wanted to buy the LibreCAL was well. Thats a very good tool in combination, I dreamed about such funtionality with my first NanoVNA already some years ago. The fiddling with SMA-connectors I see as a boring and destroying way of doing…
My first addtional investment were some SMA portsavers to protect the sensitive SMA-ports.
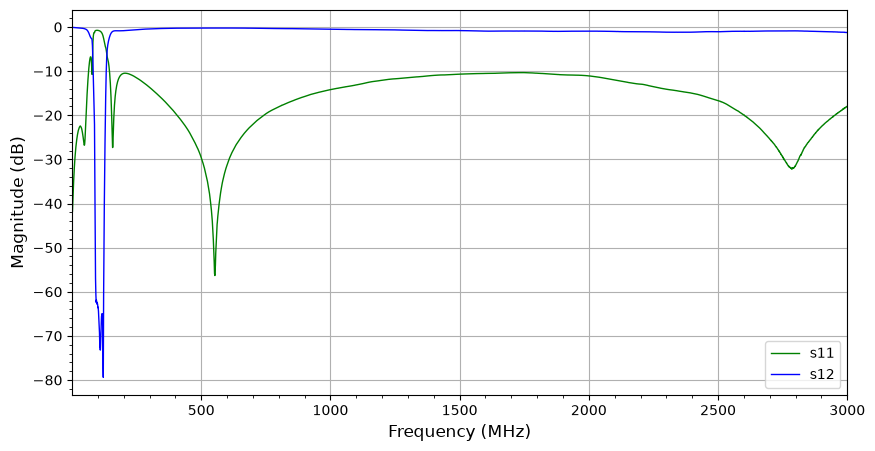
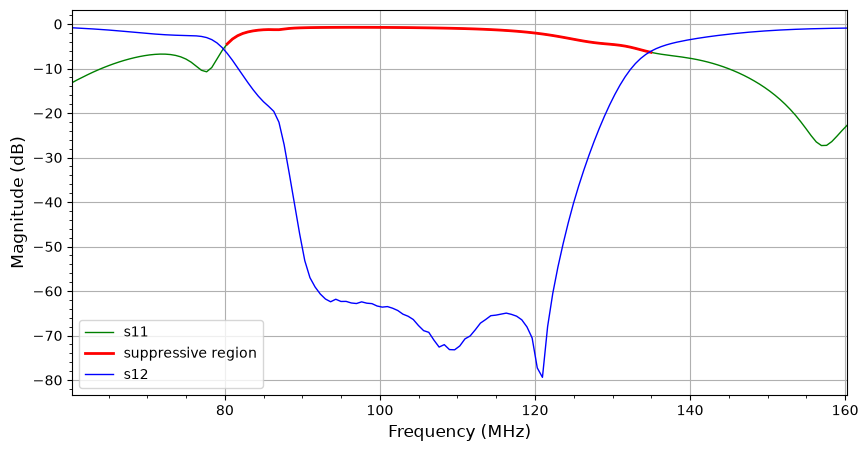
Of course I wanted to measure something immediately. An old UKW notch filter I tested first, I don’t know where it came from. Use of the filter is to suppress nearby strong broadcast radio transmitters in the the range from 87 to 108 MHz. I connected the filter to LibreVNA port 1 and port 2. From the LibreVNA-GUI app I saved a touchstone file, the used frequencies went from 1 to 3000 MHz with 4501 (max) measurement points. That would help me to zoom into the values wherever I want to.
Soon some lines of python were written …
from skrf import Network, Frequencyimport matplotlibimport matplotlib.pyplot as pltimport osfilter= Network()filter.read_touchstone('files/UKW-notch-1.s2p')filter.name ="My ukw-notch"# show the properties from the touchstone fileprint("filter properties:", filter)s11 =filter.s11s11.name ="s11"s12 =filter.s12s12.name ="s12"# lets show what we gotplt.rcParams['figure.figsize'] = [10, 5]plt.grid(True)plt.minorticks_on()plt.title =filter.nameplt.xlabel("Frequency (MHz) ", fontsize=12)plt.ylabel("Signal (db)", fontsize=12)plt.title =filter.names11.plot_s_db(c='g', lw=1, label=s11.name)s12.plot_s_db(c='b', lw=1, label=s12.name)plt.show()