# standard imports
%matplotlib inline
import matplotlib.pyplot as plt
import numpy as np
import skrf as rf
from skrf.circuit import Circuit

# Set global font size to 22
#plt.rcParams.update({'font.size': 14})


# frequency band
freq = rf.Frequency(start=0, stop=2, npoints=1001, unit='GHz')
# characteristic impedance of the ports
z0_ports = 50
# resistor
R = 100
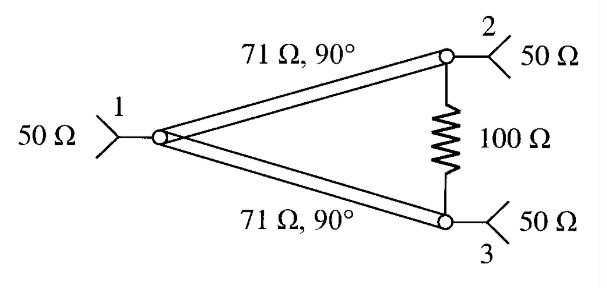
line_resistor = rf.media.DefinedGammaZ0(frequency=freq, z0=R)
resistor = line_resistor.resistor(R, name='resistor')
# branches
z0_branches = np.sqrt(2)*z0_ports
beta = freq.w/rf.constants.c
line_branches = rf.media.DefinedGammaZ0(frequency=freq, z0=z0_branches, gamma=0+beta*1j)
d = line_branches.theta_2_d(90, deg=True)  # @ 90°(lambda/4)@ 1 GHz is ~ 75 mm
branch1 = line_branches.line(d, unit='m', name='branch1')
branch2 = line_branches.line(d, unit='m', name='branch2')
# ports
port1 = Circuit.Port(freq, name='port1', z0=50)
port2 = Circuit.Port(freq, name='port2', z0=50)
port3 = Circuit.Port(freq, name='port3', z0=50)
# Connection setup
# Note that the order of appearance of the port in the setup is important
connections = [
           [(port1, 0), (branch1, 0), (branch2, 0)],
           [(port2, 0), (branch1, 1), (resistor, 0)],
           [(port3, 0), (branch2, 1), (resistor, 1)]
        ]
# Building the circuit
C = Circuit(connections)

# plot its behavior
fig, (ax1,ax2) = plt.subplots(2, 1, sharex=False)
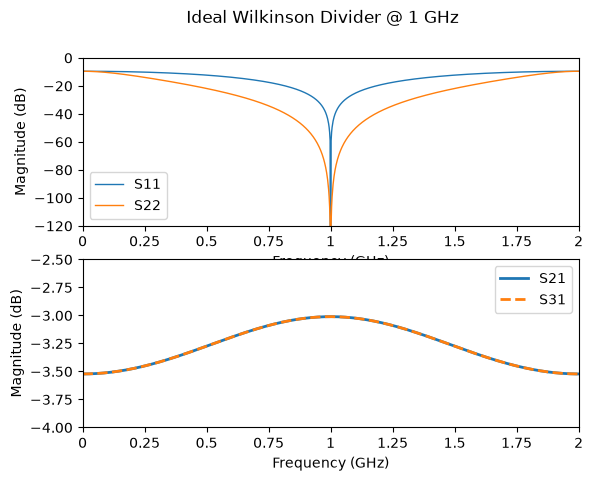
fig.suptitle('Ideal Wilkinson Divider @ 1 GHz')

C.network.plot_s_db(ax=ax1, m=0, n=0,  lw=1)  # S11
C.network.plot_s_db(ax=ax1, m=1, n=1,  lw=1)  # S22
ax1.set_ylim(-120, 0)

C.network.plot_s_db(ax=ax2, m=1, n=0,  lw=2)  # S21
C.network.plot_s_db(ax=ax2, m=2, n=0,  ls='--', lw=2)  # S31
ax2.set_ylim(-4, -2.5)