Anritsu MN510B1 + MiniCircuit attenuators

attn
equipment
Published

October 23, 2026

Anritsu MN510B1 + MiniCircuits attenuator set

front view set view

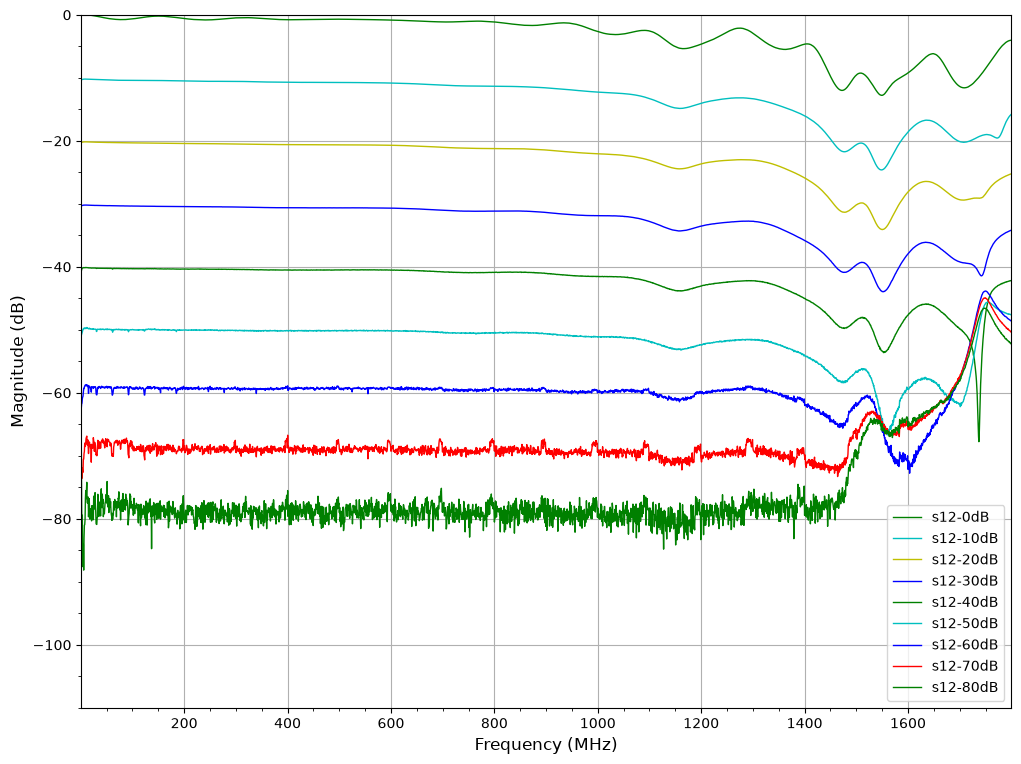
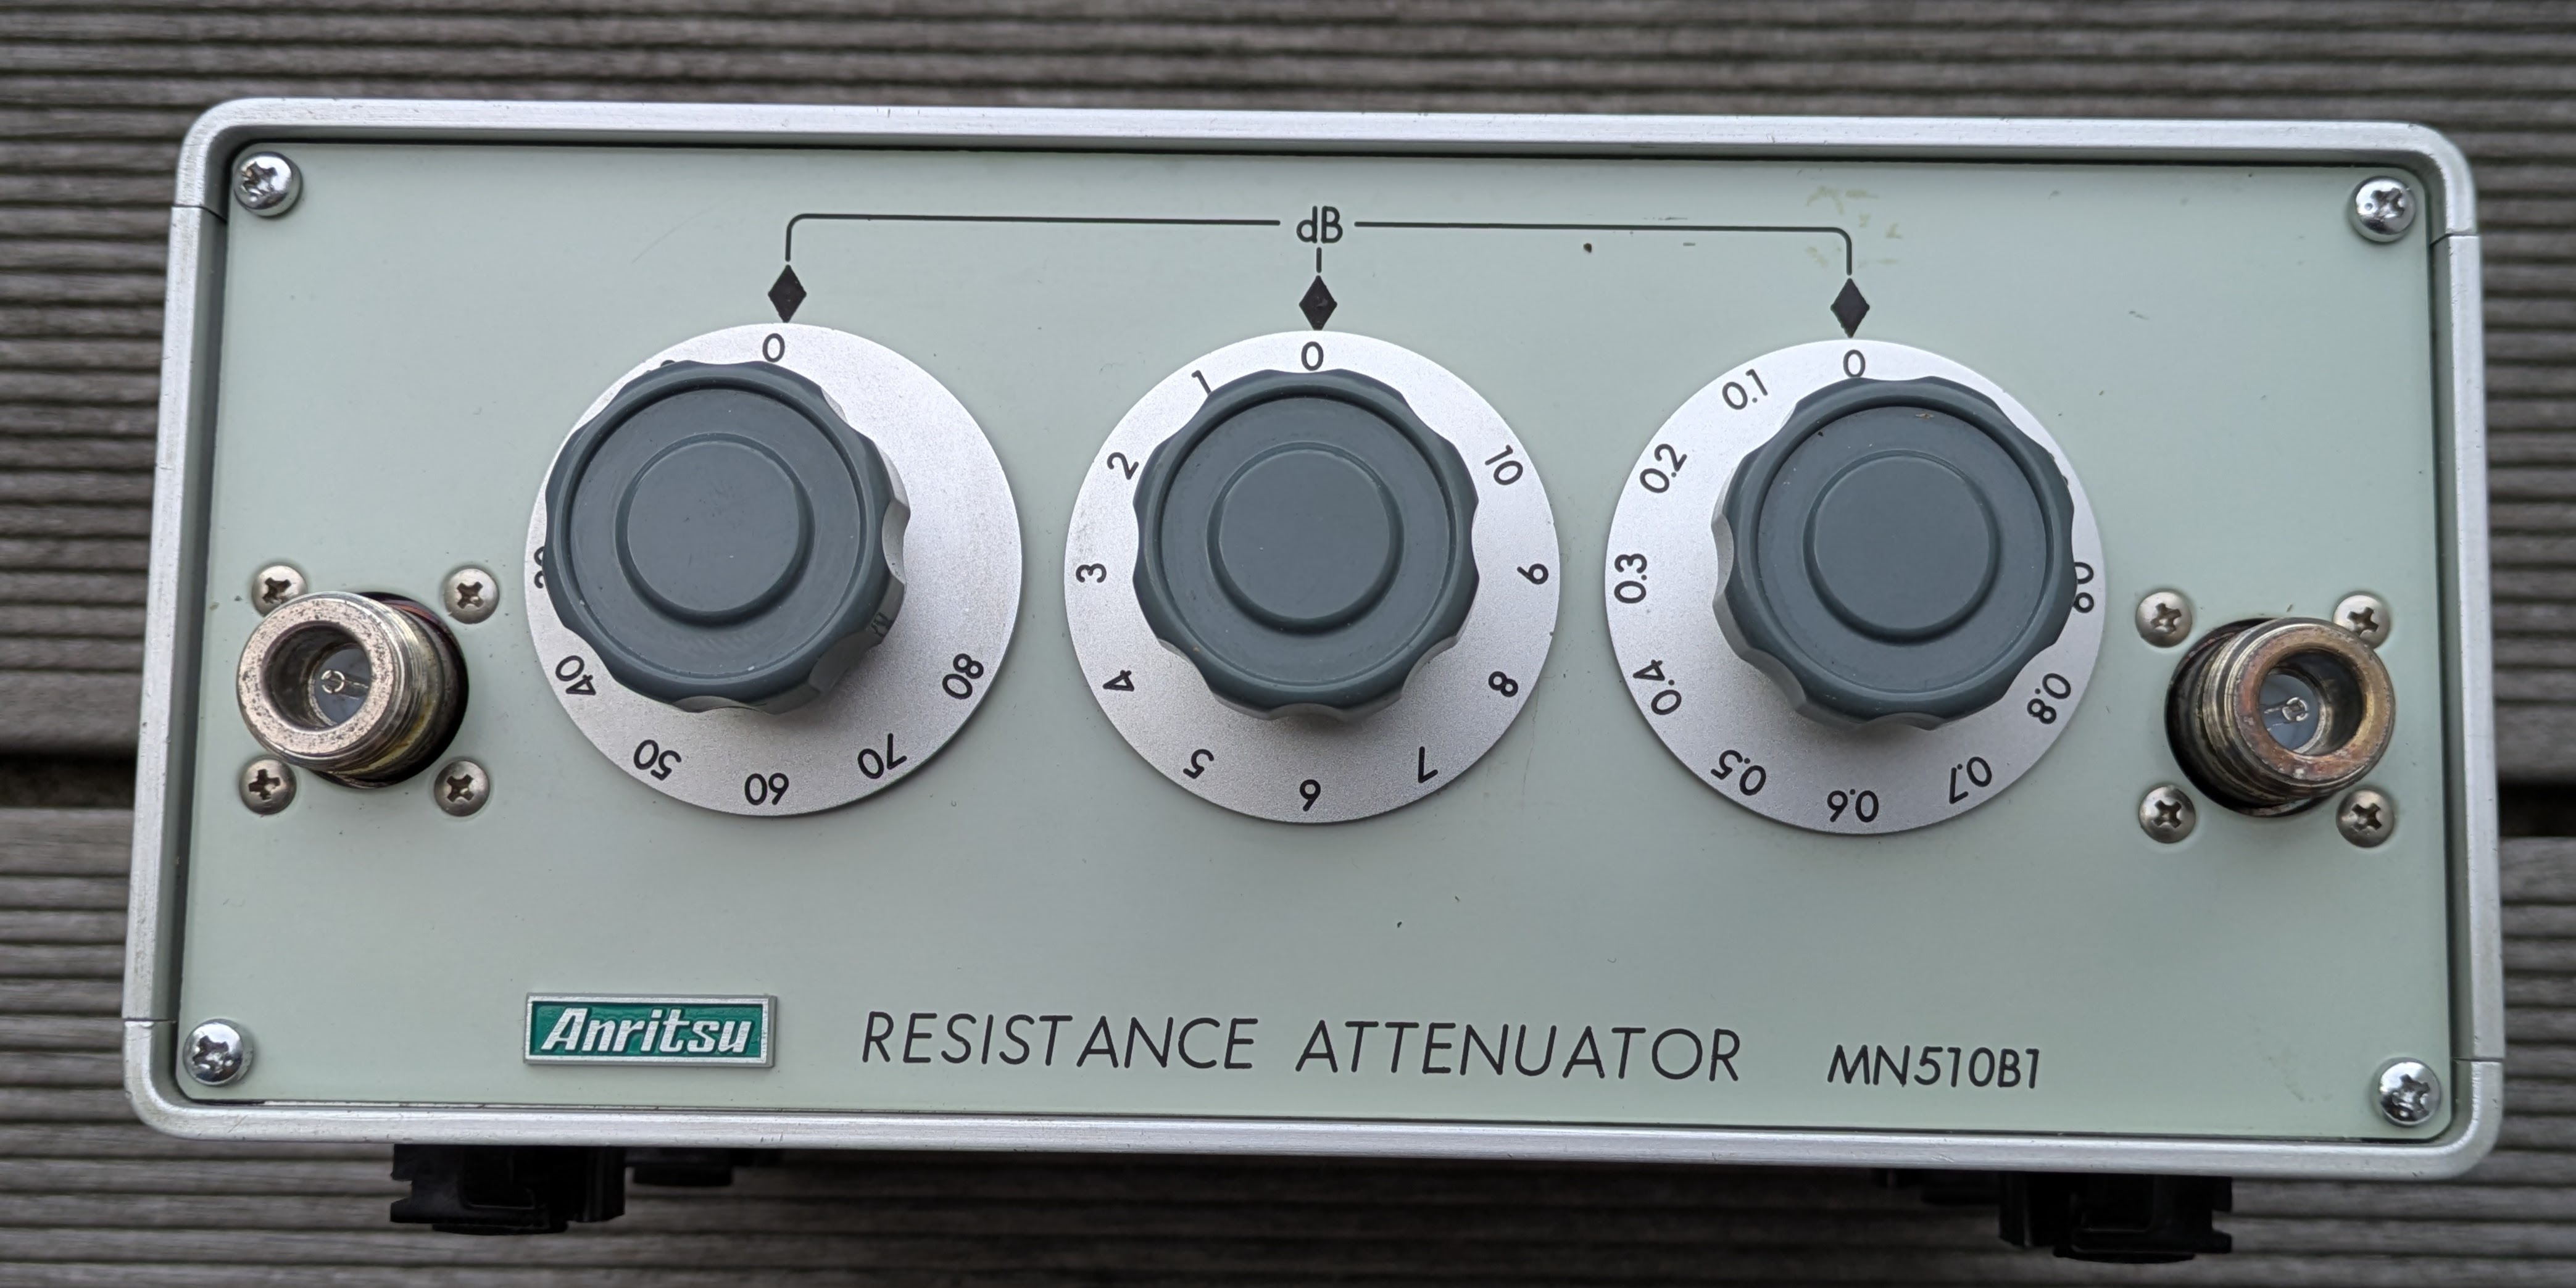
Recently I found a steppable attenuator at a fleamarket, I can’t remember where and when. I thought, what a nice part, I want it. What I saw afterwards, there are two 75 Ohm N-Ports. Nevertheless I found some 50 to 75 Ohms adapters, not very expensive, what a surprise. ;-) And the beautiful product is out of support since April, 1st, 1998. So it is almost new. At least newer than me. I used frequencies from 1 to 3000 MHz with 4501 (max) measurement points. I used some values from 0 to 80 dB by turning the left knob from step to step.

Of course the touchstone files forced me to write some lines of python …

Just to satisfy my curiosity, my Minicicuit Attenuator-set wanted to be measured, continued below the first one.

from skrf import Network, Frequency
import matplotlib
import matplotlib.pyplot as plt
import os
import sys

# Frequencys in plot
visible = '0-1800'

# these settings have been measured
attenuators = [0, 10, 20, 30, 40, 50, 60, 70, 80,]

plt.rcParams['figure.figsize'] = [12, 9]
plt.grid(True)
plt.minorticks_on()
plt.xlabel("Frequency (MHz) ", fontsize=12)
plt.ylabel("Signal (db)", fontsize=12)

for attenuator in attenuators:
    step_name = 'anritsu-' + str(attenuator)
    file_name = 'atts/' + step_name + '.s2p'
    part = Network()
    part.read_touchstone(file_name)
    s12 = part.s12[visible]
    s12.name = 's12-' + str(attenuator) +  'dB'
    line_color = 'g'
    if attenuator == 10 or attenuator == 50:
        line_color = 'c'
    if attenuator == 20:
        line_color = 'y'
    if attenuator == 30 or attenuator == 60:
        line_color = 'b'
    if attenuator == 70:
        line_color = 'r'
    s12.plot_s_db(c=line_color, lw=1, label=s12.name)
plt.ylim(0.0, -110.0)
lim = plt.ylim()[::-1]
plt.ylim(lim)
plt.show()

I only turned to 10 dB knob, but I didn’t want to get more files …

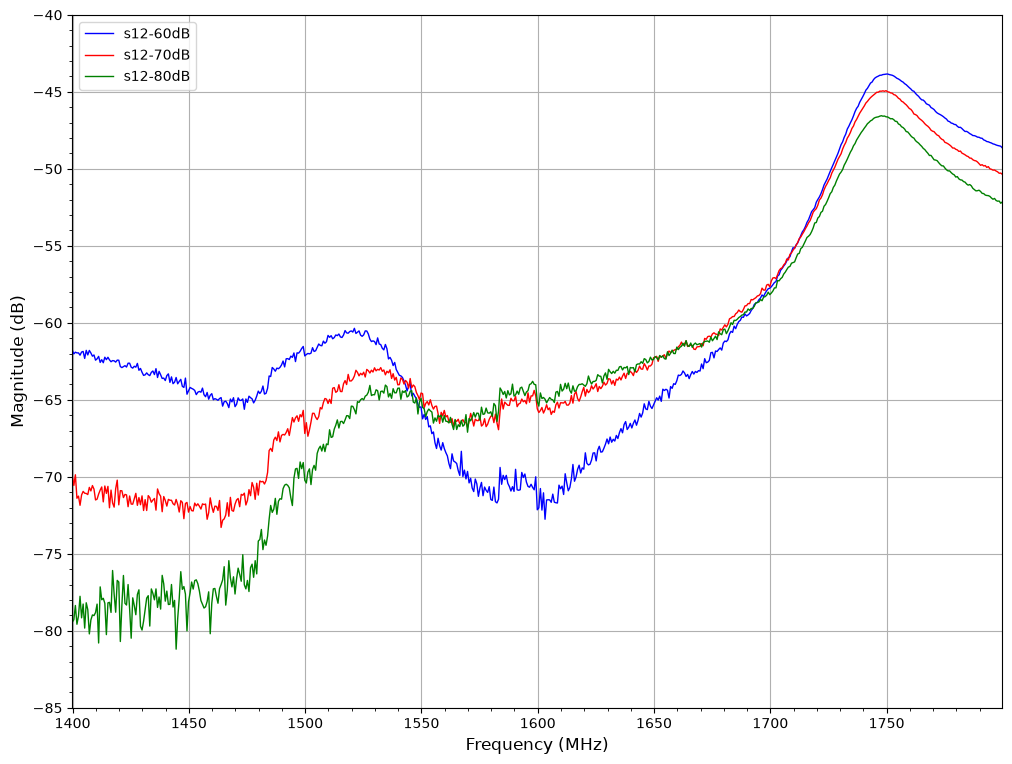
We see a strong ripple above 800 MHz. If welook above 1400 MHz, the last 3 lines are meeting in a point and the second last then is the last one afterwards. Thats not a good behavior, i.e. this is almost unusable.

Lets zoom into it there.

# Frequencys in plot
visible = '1400-1800'

# these settings have been measured
#attenuators = [0, 10, 20, 30, 40, 50, 60, 70, 80,]
attenuators = [60, 70, 80,]

plt.rcParams['figure.figsize'] = [12, 9]
plt.grid(True)
plt.minorticks_on()
plt.xlabel("Frequency (MHz) ", fontsize=12)
plt.ylabel("Signal (db)", fontsize=12)

for attenuator in attenuators:
    step_name = 'anritsu-' + str(attenuator)
    file_name = 'atts/' + step_name + '.s2p'
    part = Network()
    part.read_touchstone(file_name)
    s12 = part.s12[visible]
    s12.name = 's12-' + str(attenuator) +  'dB'
    line_color = 'g'
    if attenuator == 10 or attenuator == 50:
        line_color = 'c'
    if attenuator == 20:
        line_color = 'y'
    if attenuator == 30 or attenuator == 60:
        line_color = 'b'
    if attenuator == 70:
        line_color = 'r'
    s12.plot_s_db(c=line_color, lw=1, label=s12.name)
plt.ylim(-40.0, -85.0)
lim = plt.ylim()[::-1]
plt.ylim(lim)
plt.show()

I only turned to 10 dB knob, but I didn’t want to get more files …

For now thats all about my old steppable attenuator …

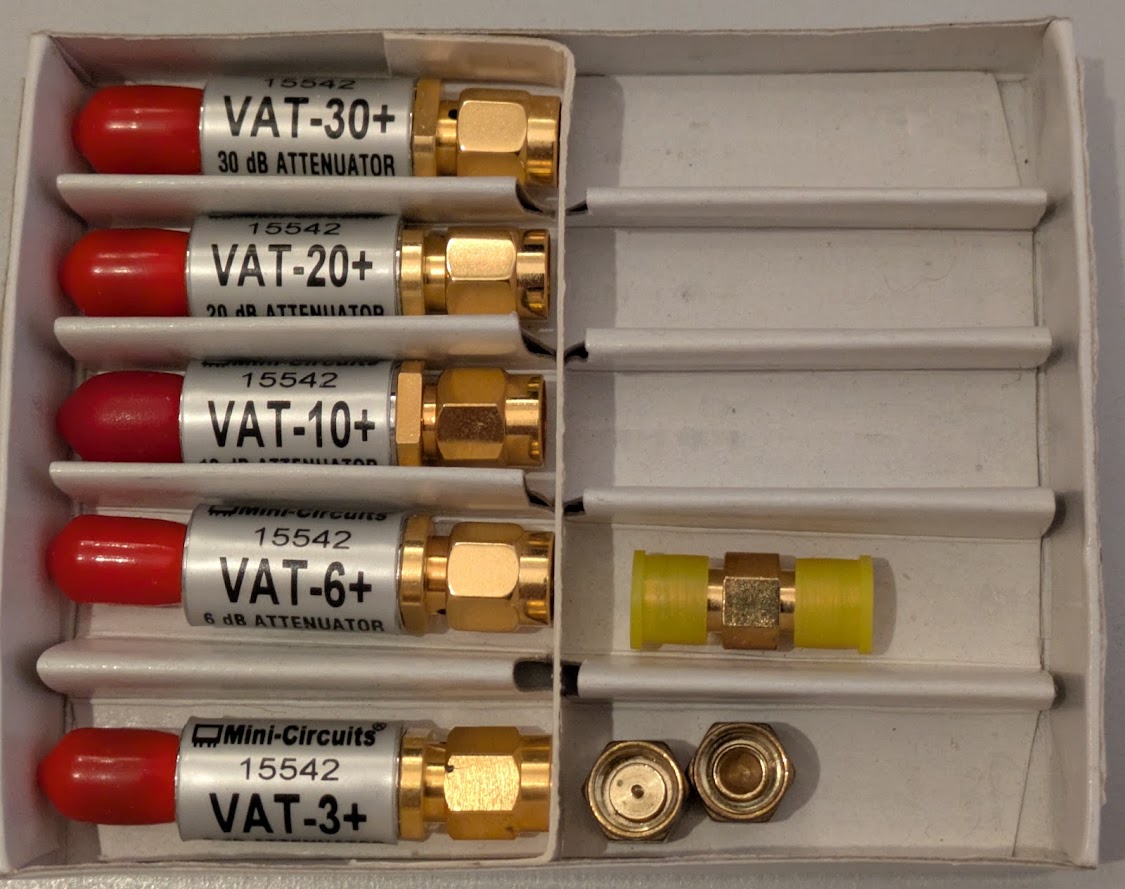
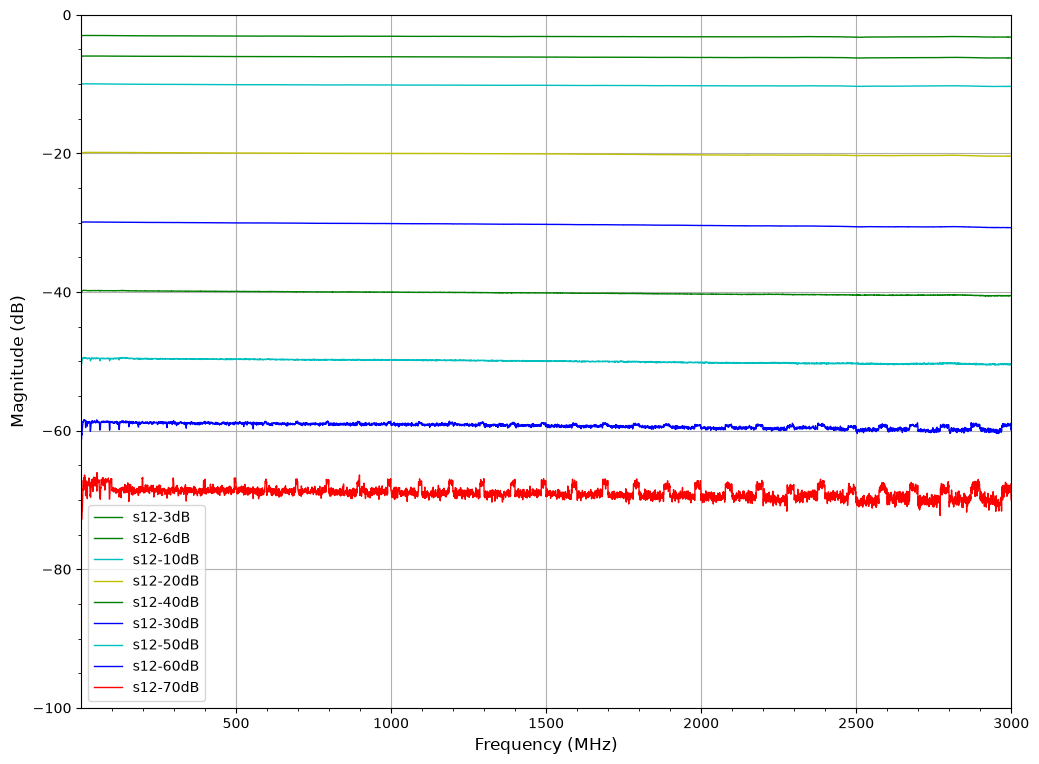
So it was time to look at some newer parts, not so very comfortable with a turning knob, but descripted to be good up to 6 GHz, the disadvantage is that you hve to screw them part to part onto the VNA…

My set contains following SMA-attenuators: 3 dB, 6 dB, 10 dB, 20 dB, 30 dB,

So higher values need to be created by lining up two or more parts …
# Frequencys in plot
visible = '1-3000'

attenuators = [3, 6, 10, 20, 40, 30, 50, 60, 70,]

plt.rcParams['figure.figsize'] = [12, 9]
plt.grid(True)
plt.minorticks_on()
plt.xlabel("Frequency (MHz) ", fontsize=12)
plt.ylabel("Signal (db)", fontsize=12)

for attenuator in attenuators:
    step_name = 'minicircuits-' + str(attenuator)
    file_name = 'atts/' + step_name + 'dB.s2p'
    if attenuator == 50:
        file_name = 'atts/minicircuits-20+30dB.s2p'
    if attenuator == 60:
        file_name = 'atts/minicircuits-10+20+30dB.s2p'
    part = Network()
    part.read_touchstone(file_name)
    s12 = part.s12[visible]
    s12.name = 's12-' + str(attenuator) +  'dB'
    line_color = 'g'
    if attenuator == 10 or attenuator == 50:
        line_color = 'c'
    if attenuator == 20:
        line_color = 'y'
    if attenuator == 30 or attenuator == 60:
        line_color = 'b'
    if attenuator == 70:
        line_color = 'r'
    s12.plot_s_db(c=line_color, lw=1, label=s12.name)
plt.ylim(0.0, -100.0)
lim = plt.ylim()[::-1]
plt.ylim(lim)
plt.show()

Lets zoom in a bit.

# Frequencys in plot
visible = '1350-1490'

#attenuators = [3, 6, 10, 20, 30, 40, 50, 60, 70,]
attenuators = [50, 60, 70,]

plt.rcParams['figure.figsize'] = [12, 6]
plt.grid(True)
plt.minorticks_on()
plt.xlabel("Frequency (MHz) ", fontsize=12)
plt.ylabel("Signal (db)", fontsize=12)

for attenuator in attenuators:
    step_name = 'minicircuits-' + str(attenuator)
    file_name = 'atts/' + step_name + 'dB.s2p'
    if attenuator == 50:
        file_name = 'atts/minicircuits-20+30dB.s2p'
    if attenuator == 60:
        file_name = 'atts/minicircuits-10+20+30dB.s2p'
    part = Network()
    part.read_touchstone(file_name)
    s12 = part.s12[visible]
    s12.name = 's12-' + str(attenuator) +  'dB'
    line_color = 'g'
    if attenuator == 10 or attenuator == 50:
        line_color = 'c'
    if attenuator == 20:
        line_color = 'y'
    if attenuator == 30 or attenuator == 60:
        line_color = 'b'
    if attenuator == 70:
        line_color = 'r'
    s12.plot_s_db(c=line_color, lw=1, label=s12.name)
plt.ylim(-44.0, -75.0)
lim = plt.ylim()[::-1]
plt.ylim(lim)
plt.show()

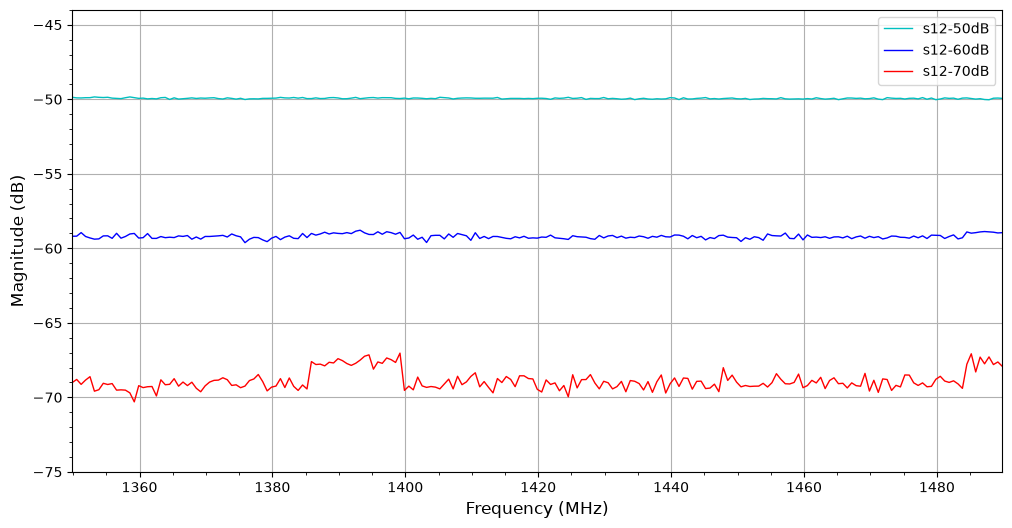
results:

To estimate the ripple on the cyan line -50 dB would need to be zoomed in a lot more.

The ripple on the blue line is estimated to 1.5 db around the -60 dB. Thats not harmful.

The ripple on the red line is about 4 db around the -70db setpoint. I can’t do better without spending much more money…

Overall these MiniCircuit attenuators are worth their price.

conclusions:

Measuring is a waste of time.

Thanks for reading.

Download: Jupyter-Notebook plus mentioned touchstone files: attenuator.ipynb.tar.gz file

Have Fun!